In the following example, we see how to create and use a formula to show sales growth by year, based on the Sample Demo in the In-Memory DB.
STEP 1
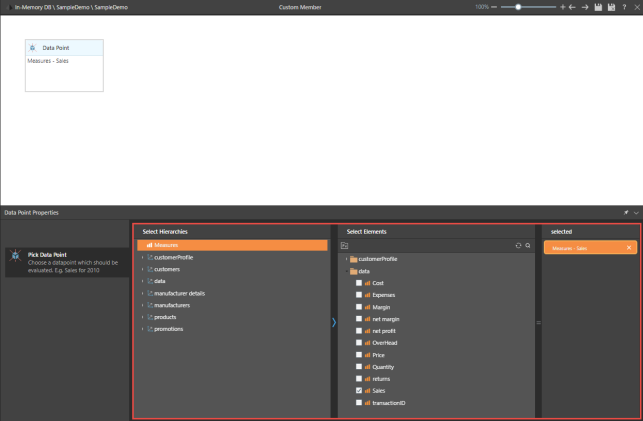
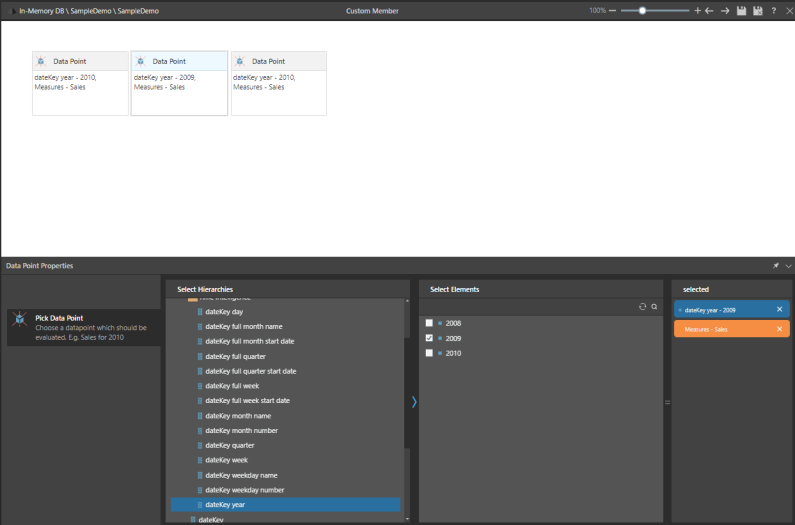
Add the Data Point node to the canvas. In the Properties dialog, select Measures from the Hierarchies window. In the Elements window, open the Data folder, and select Sales.
STEP 2
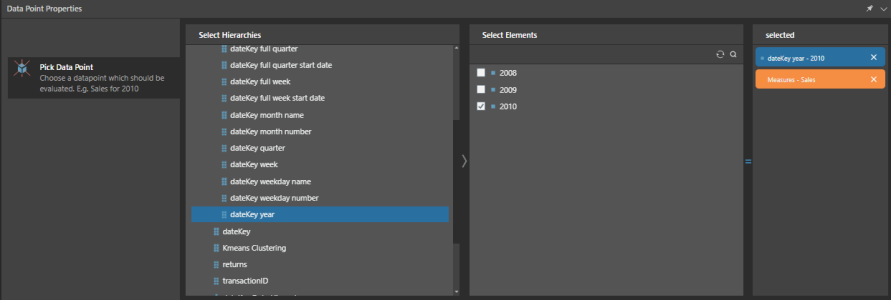
In the same dialog, open the Data dimension in the Hierarchies window. Select dateKey Year, and then select 2010 from the Elements window.
STEP 3
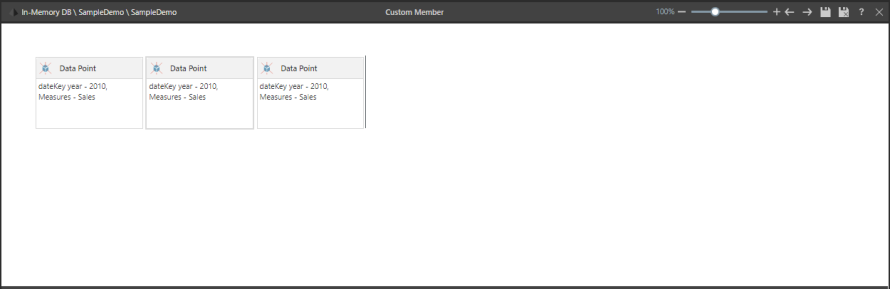
Click select the Data Point node on the canvas, and copy and paste twice (either by right clicking, or using Ctrl z and Ctrl c).
STEP 4
Click select the second node. In the Hierarchies window, open the Data dimension and select dateKey Year. Then select 2009 from the Elements window.
STEP 5
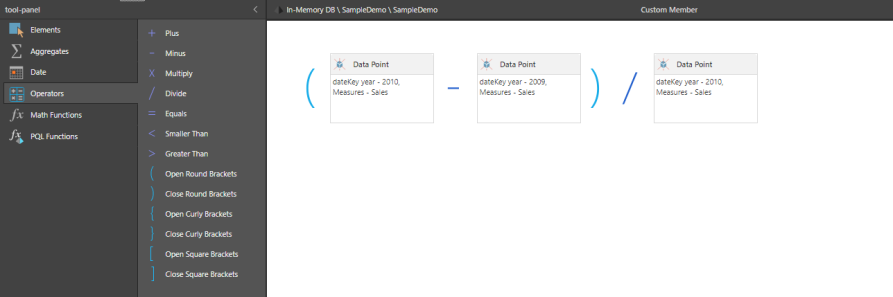
Using the Operator functions or your keyboard, place a minus sign between the first and second node, and a division sign between the second and third node. Then place brackets around the first part of the equation. You can use the arrow keys on your keyboard to navigate between the nodes.
STEP 6
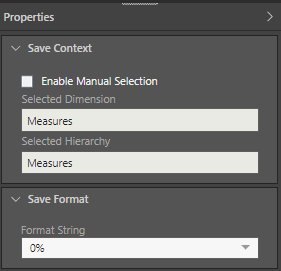
In the Properties panel on the right, review the save context, and select the save format. In this example, the format is 0%. Then click save, and save your formula.
STEP 7
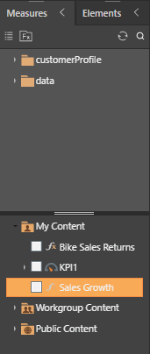
To use the formula as part of a query, open Discover. In the Measures panel, click  to access formulas. Find and select your formula.
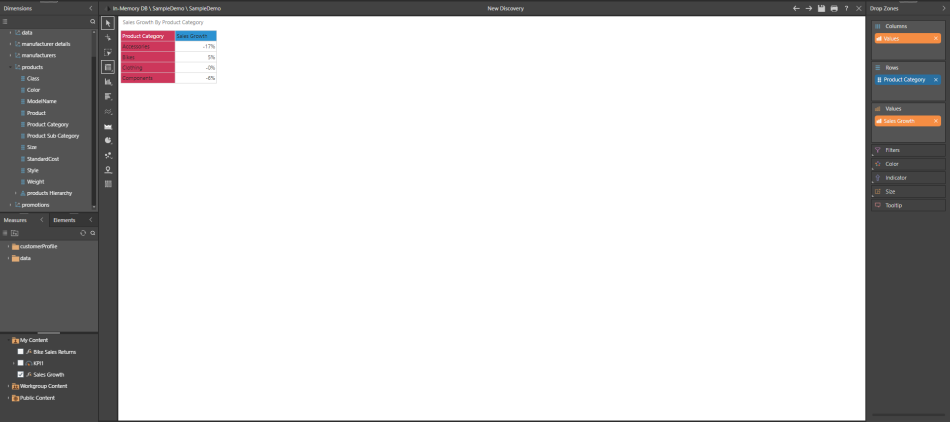
STEP 8
Add the Product Category Element to the query to see sales growth across product categories, from 2009 to 2010.